
the Creative Commons Attribution 4.0 License.
the Creative Commons Attribution 4.0 License.
 | 01 Jun 2018
The impact of QTL allele frequency distribution on the accuracy of genomic prediction
Pourya Davoudi
Rostam Abdollahi-Arpanahi
Ardeshir Nejati-Javaremi
The accuracy of genomic prediction of quantitative traits based on single nucleotide polymorphism (SNP) markers depends among other factors on the allele frequency distribution of quantitative trait loci (QTL). Therefore, the aim of this study was to investigate different QTL allele frequency distributions and their effect on the accuracy of genomic estimated breeding values (GEBVs) using best linear unbiased genomic prediction (GBLUP) in simulated data. A population of 1000 individuals composed of 500 males and 500 females as well as a genome of 1000 cM consisting of 10 chromosomes and with a mutation rate of 2.5 × 10⁻⁵ per locus was simulated. QTL frequencies were derived from five distributions of allele frequency including constant, uniform, U-shaped, L-shaped and minor allele frequency (MAF) less than 0.01 (lowMAF). QTL effects were generated from a standard normal distribution. The number of QTL was assumed to be 500, and the simulation was done in 10 replications. The genomic prediction accuracy in the first-validation generation in constant, and the uniform allele frequency distribution was 0.59 and 0.57, respectively. Results showed that the highest accuracy of GEBVs was obtained with constant and uniform distributions followed by L-shaped, U-shaped and lowMAF QTL allele frequency distribution. The regression of true breeding values on predicted breeding values in the first-validation generation was 0.94, 0.92, 0.88, 0.85 and 0.75 for constant, uniform, L-shaped, U-shaped and lowMAF distributions, respectively. Depite different values of regression coefficients, in all scenarios GEBVs are biased downward. Overall, results showed that when QTL had a lower MAF relative to SNP markers, a low linkage disequilibrium (LD) was observed, which had a negative effect on the accuracy of GEBVs. Hence, the effect of the QTL allele frequency distribution on prediction accuracy can be alleviated through using a genomic relationship weighted by MAF or an LD-adjusted relationship matrix.


Recent developments in sequencing technologies are making genome-wide high-density single nucleotide polymorphism (SNP) marker data accessible for livestock species. This information along with phenotypic data can be used to determine genomic estimated breeding values (GEBVs). The idea of predicting breeding values by molecular markers was first proposed by Nejati-Javaremi et al. (1997), and Meuwissen et al. (2001) further upgraded and propagated this method, which is employed for the genomic selection (GS) of animals. To date, simulation studies and experimental studies on GS have indicated that prediction accuracies of GS are adequate to allow rapid gains from selection, especially in dairy cattle (Hayes et al., 2009; VanRaden et al., 2009).
The accuracy of GEBVs depends on numerous issues including the number of quantitative trait loci (QTL), their locations in the genome, the distribution of allele frequencies, the effect sizes of QTL, the linkage disequilibrium (LD) between QTL and SNPs, the mode of gene action, the statistical method used for the estimation of marker effects, the size of reference population, the degree of relationship between reference and validation population and marker density (Meuwissen et al., 2001; Solberg et al., 2008; Goddard, 2009). There are some studies that discuss the impact of genetic architecture, in particular, the effect of allele frequencies on the genomic prediction accuracy (Wientjes et al., 2015; Abdollahi-Arpanahi et al., 2014a; Daetwyler et al., 2013). Daetwyler et al. (2013) reported that QTL allele frequency had an important impact on accuracy of genomic predictions. Furthermore, Uemoto et al. (2015) argued that the accuracy of GEBVs changes with respect to different minor allele frequency (MAF) of QTL. Wientjes et al. (2015) demonstrated that allele frequency spectra of QTL and the distribution of QTL effects are essential factors that determine the accuracy of both single- and multibreed genomic predictions. Abdollahi-Arpanahi et al. (2014a) found that the predictive ability of quantitative traits in broiler chickens was affected by the different categories of SNPs formed according to allele frequency. They indicated that SNPs with a low MAF delivered better predictive ability than SNPs with a high MAF, and those markers produced models with better goodness of fit statistics.
Hill et al. (2008) indicated that under strong artificial selection along with rare mutations and the balance between selection and drift, the distribution of the QTL allele frequency is more likely L-shaped or U-shaped.
Even though some studies already investigated the impact of QTL or SNP allele frequency on genomic prediction accuracy, they have assessed limited ranges of QTL allele spectra (Daetwyler et al., 2013; Uemoto et al., 2015). Therefore, in the current study simulated data were used to verify the effect of a wide range of QTL allele frequency distributions including constant, uniform, L-shaped, U-shaped and QTL distributions with a MAF of less than 0.01 (lowMAF) on the accuracy of genomic prediction.
2.1 Simulation
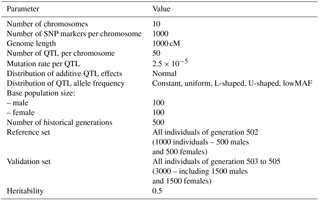
A genome consisting of 10 chromosomes with a length of 1000 cM was simulated with a per-site mutation rate of 2.5 × 10⁻⁵ using R version 3.2.4 language/environment (R Core Team, 2016). The R package hypred version 0.1 (Technow, 2011) was modified to simulate the population. Genetic recombination was performed using functions obtained from the hypred package. One thousand SNPs were equally spaced over each chromosome. In the first generation, the initial allele frequencies of all SNPs were assumed to be 0.5. Two hundred individuals, including 100 males and 100 females, were generated as base population. Sires and dams in the base population were assumed to be unrelated.
To generate a sufficient level of LD and provide the simulation with a pragmatic population structure, the base population was followed by 500 generations of random mating with an effective population size (Ne) of 200 (100 males and 100 females). Sire and dams were sampled with replacement and Ne was kept constant across generations. The number of individuals expanded to 1000 during two generations (501–502). Generation 502 was assumed as a reference population, and three more generations (503 to 505) were considered as validation populations. Parameters used for the simulation of populations and genome are shown in Table 1.
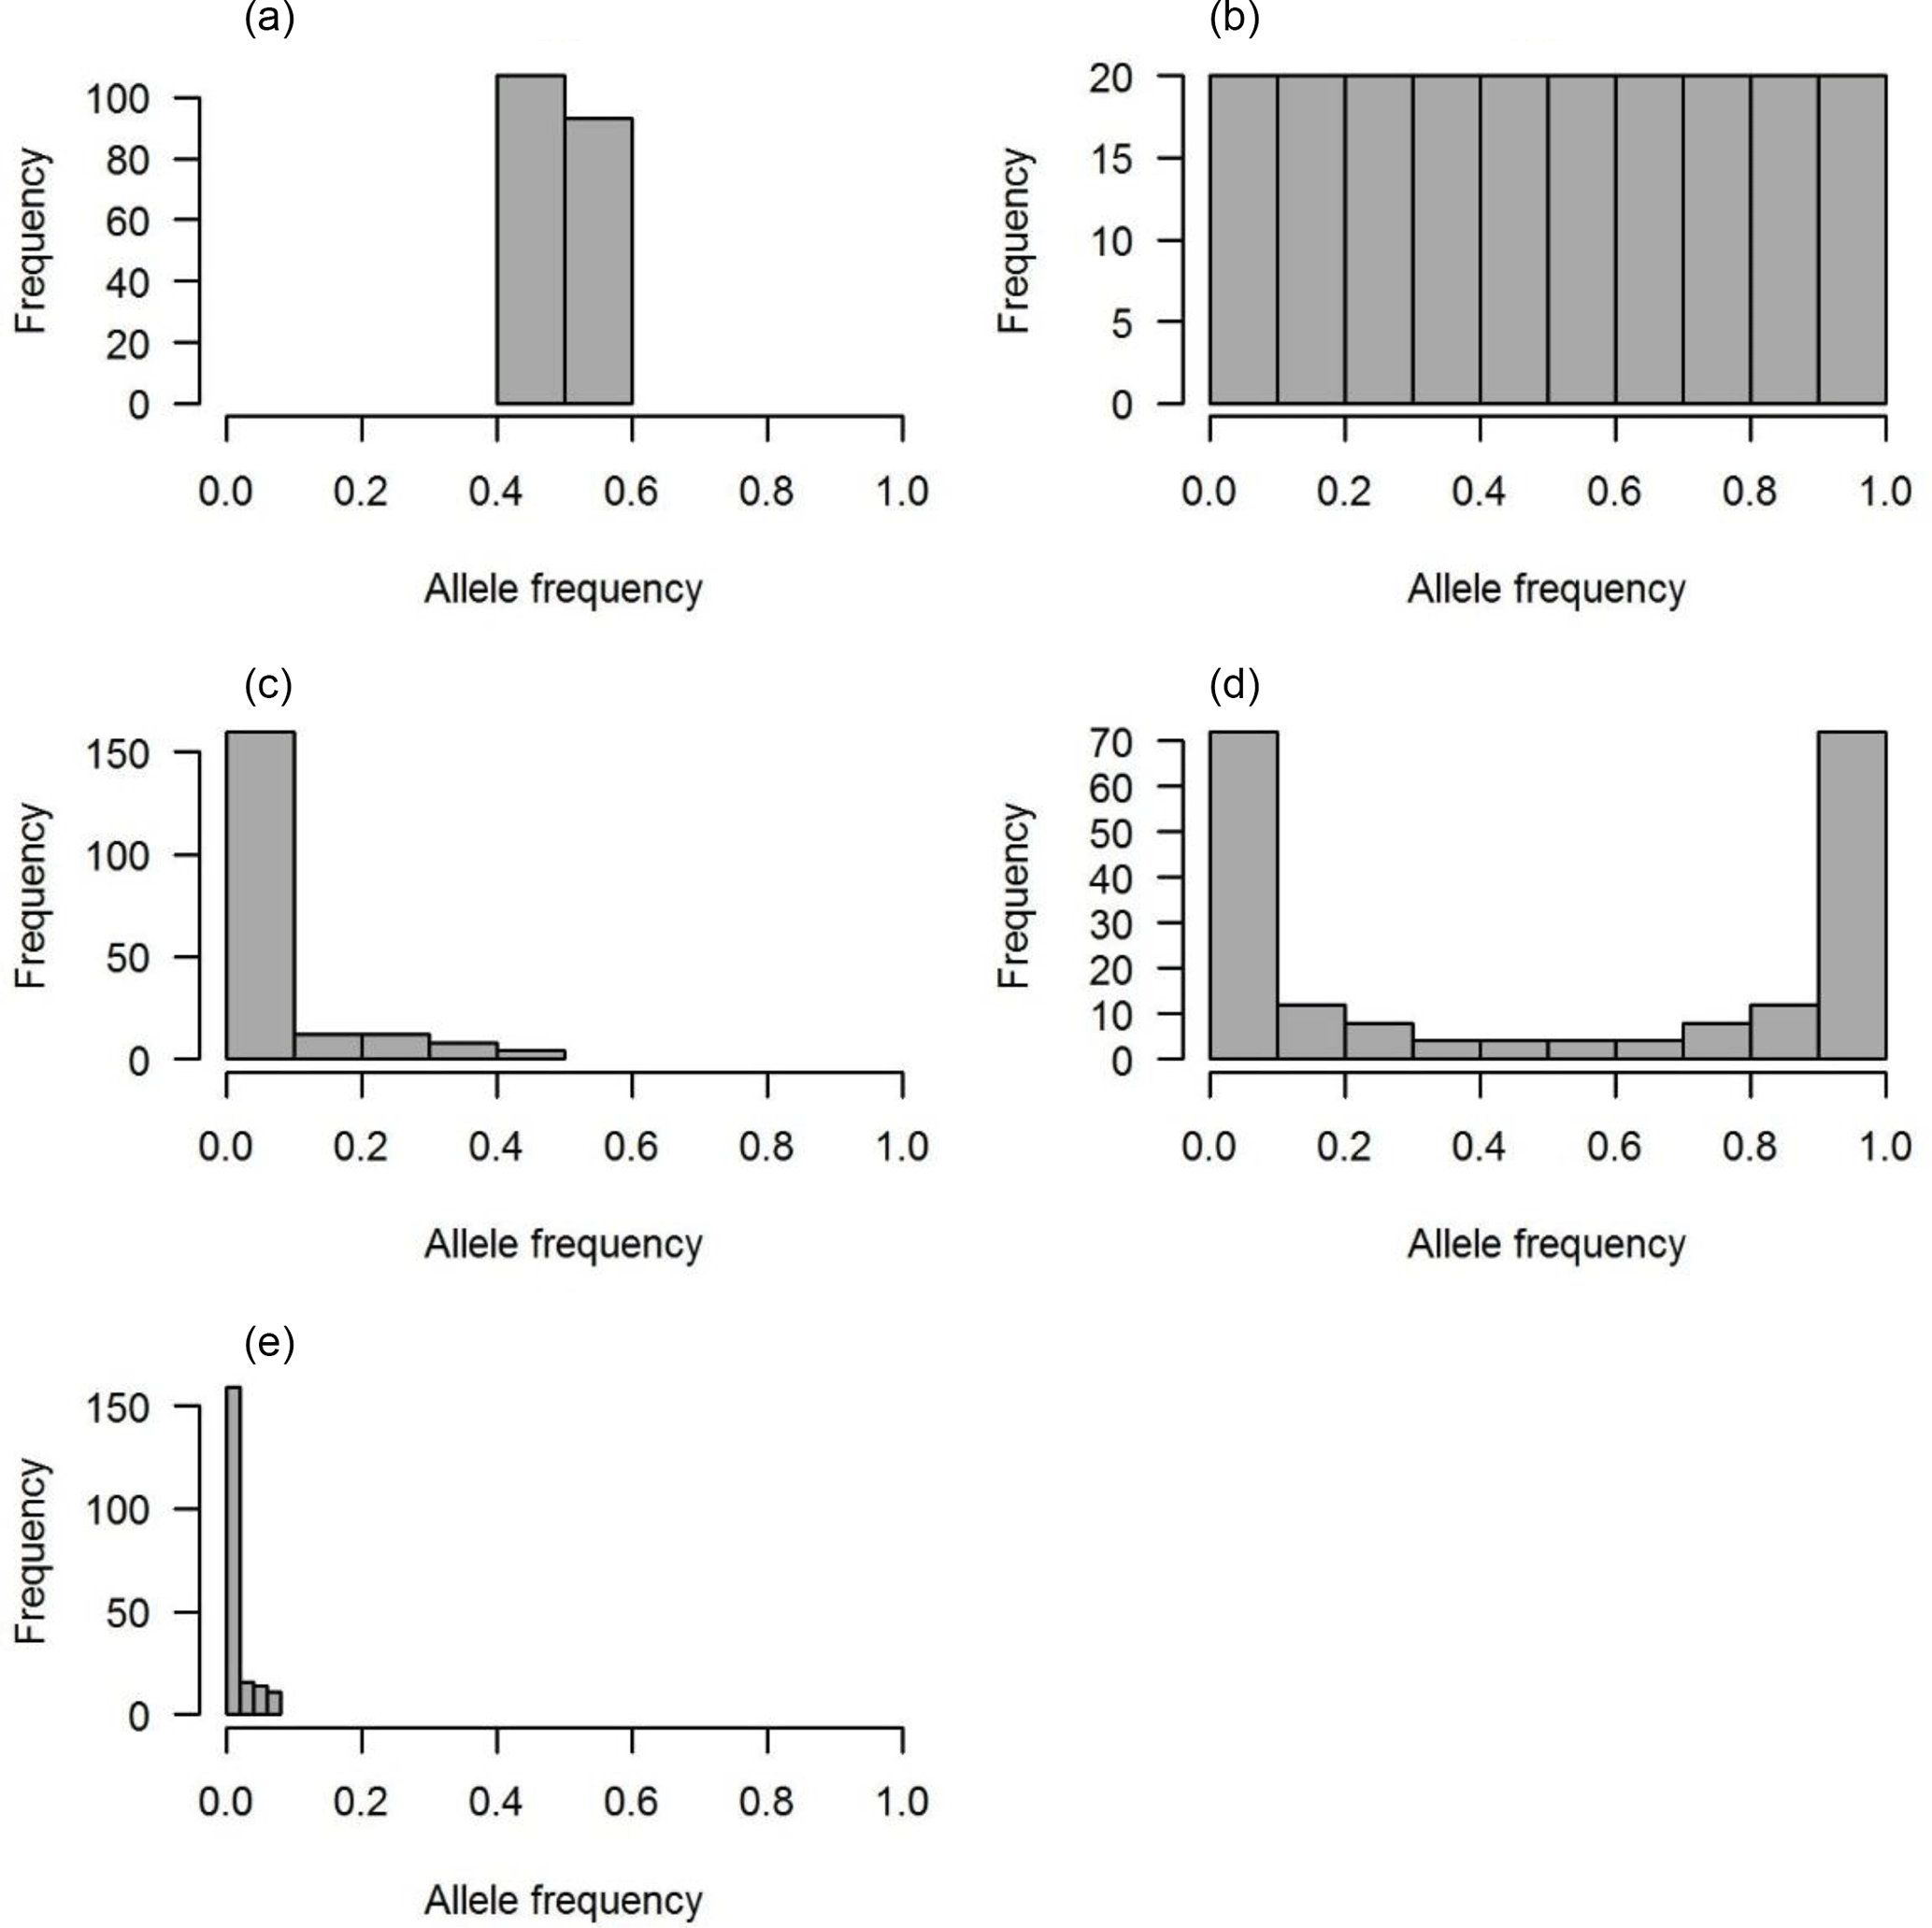
Figure 1The distributions of QTL allele frequency. (a) Constant, (b) uniform, (c) L-shape, (d) U-shape and (e) lowMAF.
Five scenarios of QTL allele spectrum including constant, uniform, L-shaped, U-shaped and QTL distribution with a MAF less than 0.01 (lowMAF) were considered. The description of the first four QTL allele frequency distributions is provided in Abdollahi-Arpanahi et al. (2014b). To achieve the desired QTL allele frequency distribution, 500 SNPs were picked up from whole pool of SNPs available in the last historical generation (500th generation), and they were identified as QTL. For instance, to create a constant QTL allele frequency, 500 SNPs with allele frequencies near 0.5 were considered as QTL. In uniform distribution, QTL allele frequency ranged between 0 and 1; in this case, first, SNPs were categorized based on their frequency and then an equal number of SNPs from each category were selected as QTL. For L- and U-shaped distributions, the chance of each SNP to be marked as QTL depends on its frequency (p). For example, in L-shaped distributions, the chance is equal to 1∕p, and in U-shaped situations for 50 % of loci, the chance of “1”-allele was 1∕p and for the other 50 % of loci, the chance of another allele, “2”-allele, was 1∕(1 − p). Consequently, the QTL allele frequency distribution became U-shaped. For a lowMAF scenario, SNP markers with a MAF of less than 0.01 were marked as QTL. So, the average MAF in this scenario was lower than L-shaped and U-shaped QTL allele frequency distributions (Fig. 1e). The realized distribution of the QTL allele frequency is given in Fig. 1. In all scenarios, QTL were uniformly distributed across the genome.
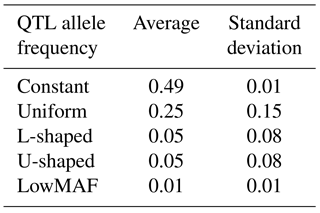
Each distribution of the QTL allele frequency according to its shape has a different average MAF (Table 2).
Table 2Average of the MAF in different distributions of the QTL allele frequency.
After all QTL effects (α′) were generated from a standard normal distribution, their effects were standardized to achieve a total genetic variance of 1, i.e. αq = , where subscripts i(q) denote the ith(qth) QTL; the summation is over all QTL; α is the standardized value of the additive effect of QTL (Meuwissen and Goddard, 2010). The genetic value, AQTLqj, of individual j at locus q in the population is
where mq is the mid-homozygote value at locus q, xqj is the number of high alleles (0, 1, or 2) of individual j at locus q, and αq is the additive allele effect at locus q (Bost et al., 2001). The true genetic value (TBV) of individual j for the trait is computed under an additive model as
The phenotype of each individual was generated by adding its genetic value to a normally distributed error: N(0, (1 − h2)∕h2), where h2 is the heritability. The simulation program was repeated 10 times.
2.2 Statistical model
The reference set data were analysed by the genomic best linear unbiased prediction (GBLUP) method with the following model:
where y is the vector of individual phenotypes; μ is the intercept, and 1 is a vector of ones; g ∼ N(0, ) is the random vector of additive genetic values; G is a matrix of additive genomic relationships; is the genetic variance; e ∼ N(0, ) is the vector of model residuals, where is the residual variance and I is an identity matrix. A typical element of G was calculated as VanRaden (2008).
where xij is the number of copies of the reference allele for the ith SNP in the jth individual, pi is the frequency of the reference allele obtained from the current sample, and m is the number of markers.
The prediction of breeding values for individuals in validation set () was as below (Abdollahi-Arpanahi et al., 2015):
where is vector of predicted genetic values on reference set individuals; Gval,ref is rectangular matrix of genomic relationships between individuals in validation and reference samples, and Gref is the genomic relationship between reference set individuals.
The accuracy of predicted genomic breeding values were obtained from correlation between true breeding values and predicted breeding values. Although the correlation between predicted breeding values and true breeding values is the common criterion to measure the accuracy of evaluations, the regression of true breeding values on predicted breeding values is another index for assessing the prediction accuracy (Daetwyler et al., 2013). The true breeding values were linearly regressed on the predicted GEBV, where the regression coefficient reflected the degree of bias of the GEBV prediction. A regression of true breeding values on predicted breeding values of 1 indicates no bias. Correlation and regression of GEBVs for the three validation generations were evaluated. The simulated data sets were replicated 10 times.

Figure 2Accuracy of genomic estimated breeding values using genomic best linear unbiased prediction for different distributions of the QTL allele frequency. The whiskers represent 95 % asymptotic confidence intervals.
3.1 Accuracy of prediction
In the first-validation generation the mean of obtained accuracy (0.53) from all scenarios was lower than the expected accuracy (0.70) according to the formula derived by Daetwyler et al. (2010). The accuracy of GEBVs in different distributions of the QTL allele frequency is given in Fig. 2. Results showed that in all scenarios and generations, the accuracy of genomic prediction for a constant allele frequency distribution was highest and was followed by uniform, U-shaped, L-shaped and lowMAF allele frequency distributions.
The accuracy in the first-validation generation in constant, and the uniform allele frequency distribution was 0.59 and 0.57. When the distribution of the QTL allele frequency was U-shaped, the accuracy was 9 and 6 % lower compared to the constant and uniform allele frequency, respectively. A similar trend was observed for L-shaped allele frequency. For lowMAF, this reduction in accuracy was slightly more and 15 % lower than the constant allele frequency.
As shown in Table 2, the mean MAF was different in different distributions of QTL allele frequencies. Wientjes et al. (2015) showed that when QTL have lowMAF, the accuracy of breeding values is also low. Results of this study are in agreement with those findings. Daetwyler et al. (2013) simulated several traits with a MAF of QTL less than 0.10 and found that the accuracy ranged from 0.45 to 0.50, while without this constraint, accuracy varied from 0.53 to 0.55. That study reported that this reduction in accuracy was generally observed for all genomic evaluation methods.
The LD between adjacent markers in generation 500, calculated using r2 statistics, was equal to 0.24 in an average of 10 replicates. The mean of r2 between QTL and adjacent markers was affected by the allele frequency distribution of QTL (Table 3). When QTL allele frequency distribution was constant the highest r2 was observed, and the lowest r2 was obtained with lowMAF scenario. In line with our findings, Uemoto et al. (2015) classified QTL according to average MAF, and showed that as the mean MAF decreased, the amount of LD between SNPs and QTL reduced, and it led to the decrease in the accuracy of genomic predictions.
Sun et al. (2015) examined the simultaneous changes in QTL and SNP frequencies and observed the lowest prediction accuracy (0.61) when the MAF of QTL and SNPs was less than 0.06. The highest prediction accuracy occurred when both the MAF of QTL and SNPs are more than 0.06 (0.83). However, these authors argued that when a trait is controlled by rare QTL (QTL with a frequency of less than 0.06), the fitting haplotype yields a higher accuracy, and this could be explained by the fact that haplotypes tended to be in higher or complete LD with QTL than single SNPs, regardless of the MAF of QTL. It has been reported that if QTL have a small MAF but SNPs on the chip have a common MAF, the extent of LD will be low; a higher density of SNPs on the chip does not circumvent this problem because high LD requires a similar MAF of QTL and SNP (Sun et al., 2015; MacLeod et al., 2014). Due to the ascertainment bias of the SNPs on the chip (Matukumalli et al., 2009), LD between SNPs and QTL reduces when the allele frequency of QTL becomes more extreme. This means that the SNPs do not provide an explanation for all of the QTL variance, which leads to a lower accuracy, which is also shown in other studies (Daetwyler et al., 2013; de los Campos et al., 2013).
Although in genetic association studies, the r2 measure between the two loci has long been used as a measure of the LD between them, r2 has always been constrained with the difference between couple alleles. While many studies have investigated the dependence of r2 on the allele frequency between two loci (Devlin and Risch, 1995; Hedrick, 1987; Hill and Robertson, 1968), Wray (2005) showed that r2 is more constrained with the difference in allele frequency between two loci. Therefore, the low allele frequency of QTL can be a reason for the low accuracy of genomic prediction in some cases.
Yan et al. (2009) demonstrated that the MAF is a key factor that influences the estimation of the extent of LD. Within the distance of maize LD (5–10 kb), mean r2 increases with the increase in MAF, and the same occurrence was also observed in other species (Khatkar et al., 2014). Khatkar et al. (2014) showed that the MAF has a strong effect on mean r2, especially at short distances (up to 40 kb). They proposed a possible clarification, namely that as the MAF threshold increases, there is an increase in the number of SNP pairs with similar allele frequencies and, thus, an increase in r2. However, different factors such as population size, types of selection, the mating system, the structure of LD across the genome, and environmental effects can influence the distribution of the QTL allele frequency in the population (Bost et al., 2001).
Table 3Mean of linkage disequilibrium value (r2) between QTL and adjacent SNPs for different distributions of QTL allele frequency.
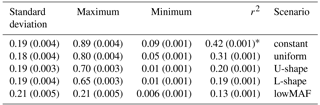
* Values within parenthesis shows the standard error of 10 replicates.
Investigating the effects of QTL allelic frequencies allows us to improve genomic evaluation methods by considering the effect of QTL allele spectra. Meuwissen et al. (2011) suggested that a genomic relationship matrix weighted by MAF would have a better result than an unweighted genomic relationship matrix, when a high percentage of loci with a low MAF are used. Speed et al. (2012) proposed a method for weighting markers to account for LD. Their method, LD-adjusted kinships, examined the local SNP correlation caused by LD and computed optimal SNP weights by solving a linear program.
As shown in Fig. 2, the more distance between reference set and validation set, the greater the decrease in the accuracy of prediction. This was expected because as the distance between reference set and validation set increases, the linkage phase between QTL and marker may vary more often, LD decreases, and so the effects of QTL cannot be captured sufficiently by the markers. Furthermore, the decrease in relationship between the populations mentioned leads to a decline in accuracy. These results are consistent with previous results (Muir, 2007; Habier et al., 2007).
3.2 Regression of true breeding values on predicted breeding values
The value of regression coefficients in the first-validation generation was 0.94, 0.92, 0.88, 0.85 and 0.75 for constant, uniform, L-shaped, U-shaped and lowMAF distribution, respectively (Fig. 3). In a lowMAF distribution, regression coefficients were highly downward biased whereas in other distributions of allele frequency (constant, uniform, L-shaped, U-shaped), the bias reduced. This higher bias in the estimates in the lowMAF distribution could be the result of the QTL with a low MAF so that their effects cannot be explained by SNPs. In line with our findings, Solberg et al. (2008) showed that the regression of true breeding values on predicted breeding values increased when the amount of LD gradually increased in the population. Since LD can be affected by the difference in allele frequency between QTL and SNP, higher LDs can be seen in scenarios with a higher MAF of QTL. These variations in LD directly affect the accuracy and regression coefficient and trigger changes in different scenarios.
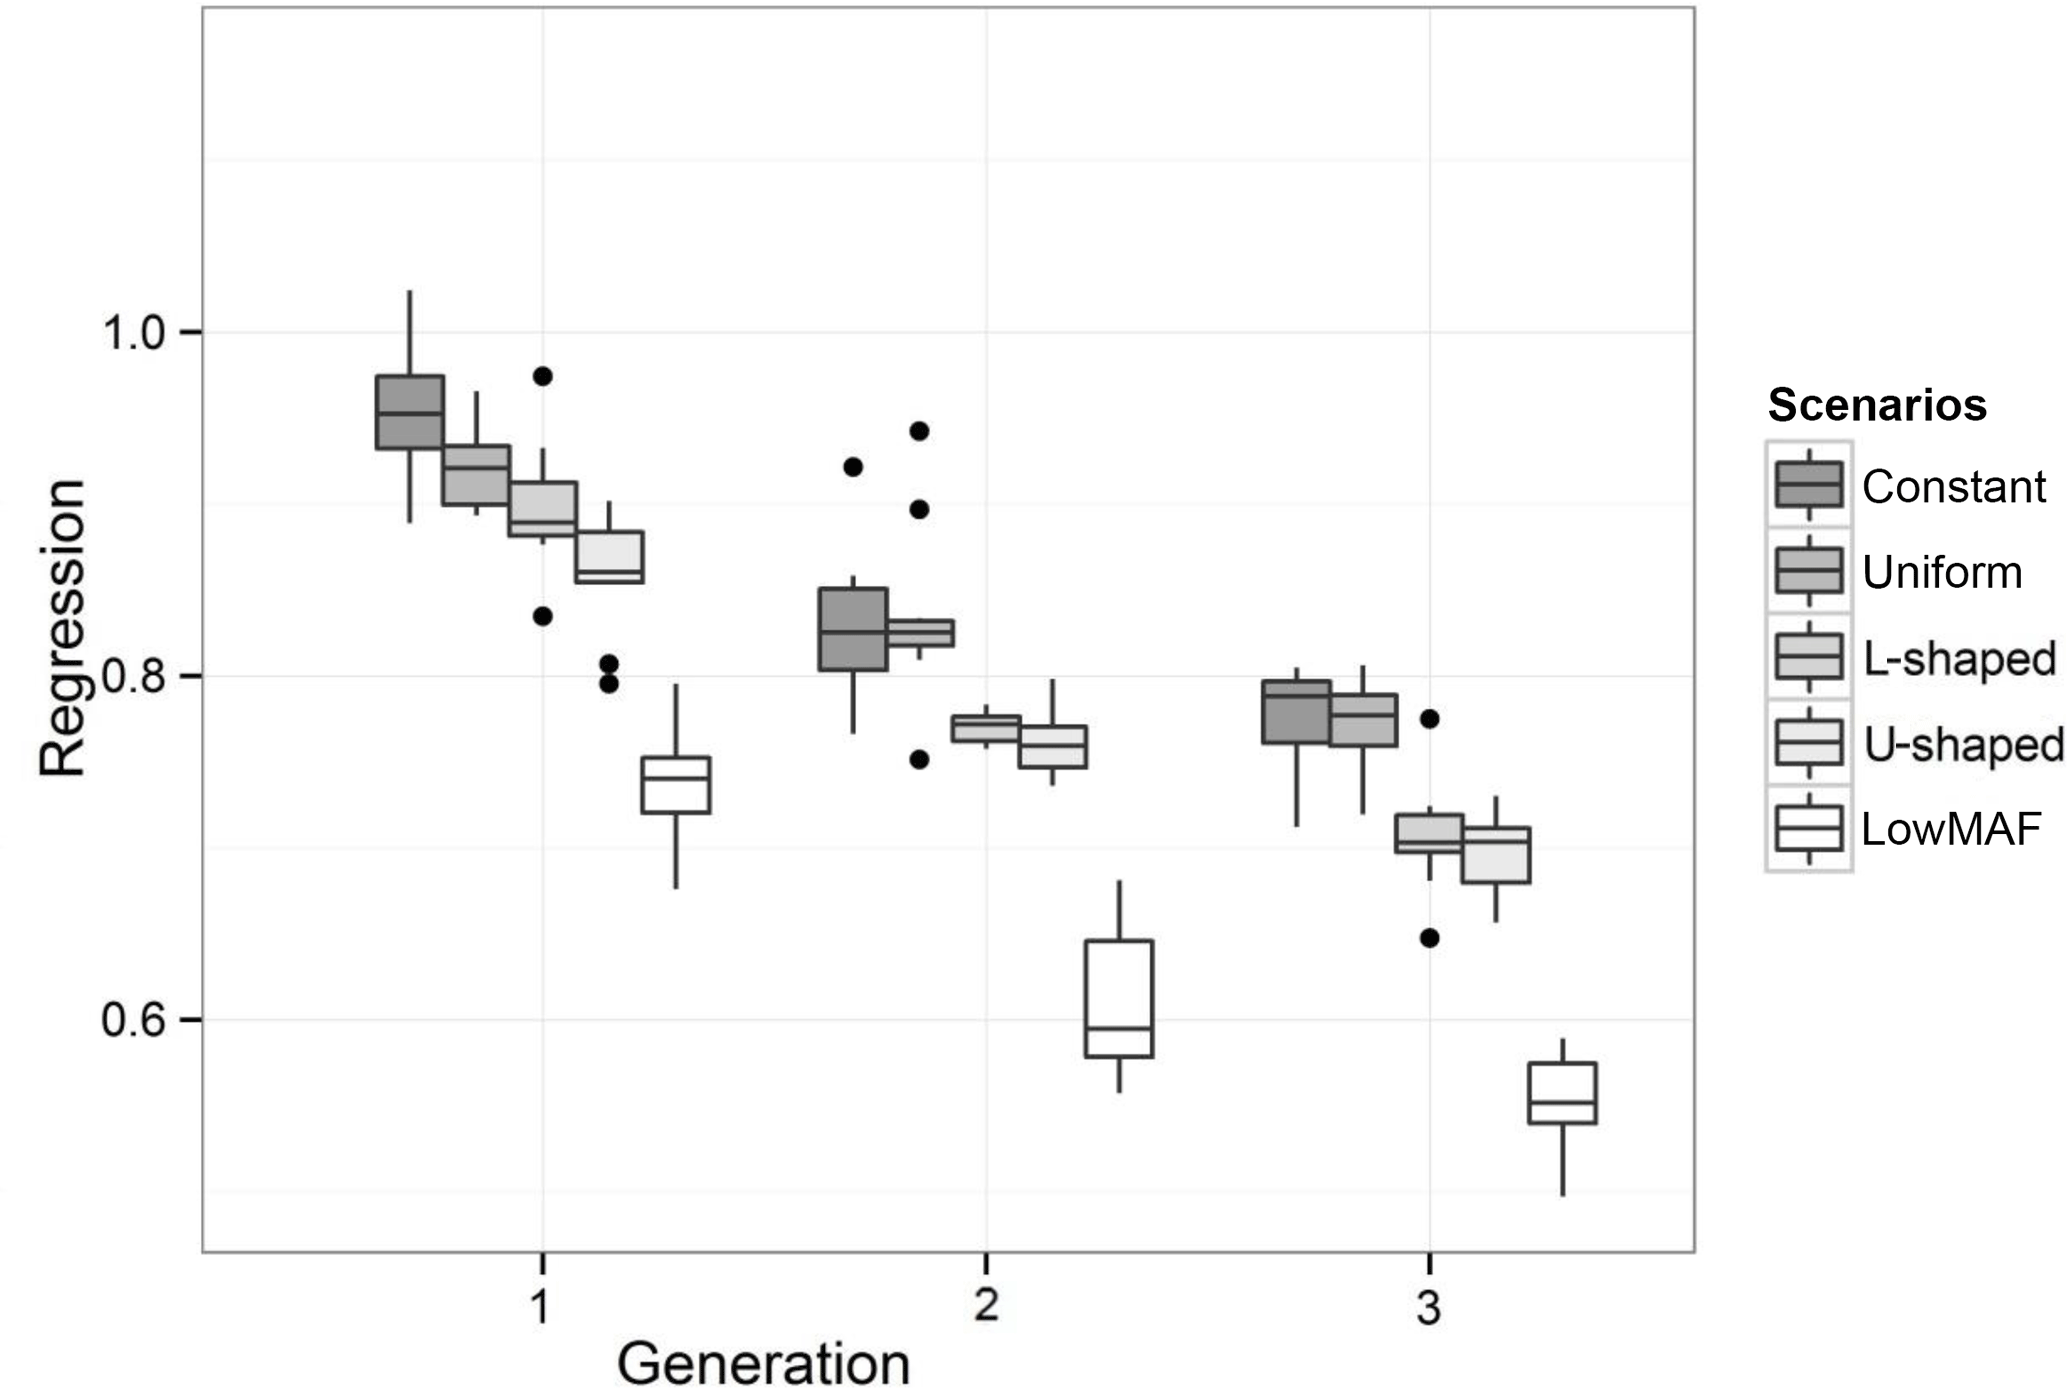
Figure 3Regression of true breeding values on predicted breeding values for different distributions of the QTL allele frequency. Outliers denoted as black dots.
Results showed that the accuracy of GEBVs largely depends on the distribution of the QTL allele frequency. When the QTL allele frequency was constant, the highest accuracy of GEBVs was observed and the lowest accuracy was delivered in the lowMAF category. The magnitude of LD between SNPs and QTL was dramatically affected by the allele frequency of QTL. This simulation study showed that when QTL allele frequency distribution was such that QTL had a lower MAF, a lower LD was observed, which had a negative effect on the accuracy of GEBVs. Hence, since most QTL in livestock populations have a low MAF, the effect of the QTL allele frequency distribution on prediction accuracy can be alleviated through using a genomic relationship weighted by MAF or LD-adjusted relationship matrix.
Simulated data sets were used in this article and the R-script is available upon request.
The authors declare that they have no conflict of interest.
We highly appreciate the comments and suggestions by Nina Melzer as the
editor and by two reviewers (Farhad Ghafouri-Kesbi and one anonymous referee) who significantly
contributed to improving the quality of the publication.
Edited by: Nina Melzer
Reviewed by: Farhad Ghafouri-Kesbi and one anonymous referee
Abdollahi-Arpanahi, R., Nejati-Javaremi, A., Pakdel, A., Moradi-Shahrbabak, M., Morota, G., Valente, B. D., Kranis, A., Rosa, G. J. M., and Gianola, D.: Effect of allele frequencies, effect sizes and number of markers on prediction of quantitative traits in chickens, J. Anim. Breed. Genet., 131, 183–193, 2014a.
Abdollahi-Arpanahi, R., Pakdel, A., Nejati-Javaremi, A., Moradi Shahrbabak, M., and Ghafouri-Kesbi, F.: The relation between the genetic architecture of quantitative traits and long-term genetic response, J. Appl. Genet., 55, 373–381, 2014b.
Abdollahi-Arpanahi, R., Morota, G., Valente, B., Kranis, A., Rosa, G., and Gianola, D.: Assessment of bagging GBLUP for whole-genome prediction of broiler chicken traits, J. Anim. Breed. Genet., 132, 218–228, 2015.
Bost, B., de Vienne, D., Moreau, L., and Dillmann, C.: Genetic and nongenetic bases for the L-shaped distribution of quantitative trait loci effects, Genetics, 157, 1773–1787, 2001.
Daetwyler, H. D., Pong-Wong, R., Villanueva, B., and Woolliams, J. A.: The impact of genetic architecture on genome-wide evaluation methods, Genetics, 185, 1021–1031, 2010.
Daetwyler, H. D., Calus, M. P., Pong-Wong, R., de los Campos, G., and Hickey, J. M.: Genomic prediction in animals and plants: simulation of data, validation, reporting, and benchmarking, Genetics, 193, 347–365, 2013.
de los Campos, G., Vazquez, A. I., Fernando, R., Klimentidis, Y. C., and Sorensen, D.: Prediction of complex human traits using the genomic best linear unbiased predictor, PLoS Genet., 9, e1003608, https://doi.org/10.1371/journal.pgen.1003608, 2013.
Devlin, B. and Risch, N.: A comparison of linkage disequilibrium measures for fine-scale mapping, Genomics, 29, 311–322, 1995.
Goddard, M.: Genomic selection: prediction of accuracy and maximisation of long term response, Genetica, 136, 245–257, 2009.
Habier, D., Fernando, R., and Dekkers, J.: The impact of genetic relationship information on genome-assisted breeding values, Genetics, 177, 2389–2397, 2007.
Hayes, B., Bowman, P., Chamberlain, A., and Goddard, M.: Invited review: Genomic selection in dairy cattle: Progress and challenges, J. Dairy Sci., 92, 433–443, 2009.
Hedrick, P. W.: Gametic disequilibrium measures: proceed with caution, Genetics, 117, 331–341, 1987.
Hill, W. and Robertson, A.: Linkage disequilibrium in finite populations, Theor. Appl. Genet., 38, 226–231, 1968.
Hill, W., Goddard, M. E., and Visscher, P. M.: Data and theory point to mainly additive genetic variance for complex traits, PLoS Genet., 4, e1000008, https://doi.org/10.1371/journal.pgen.1000008, 2008.
Khatkar, M. S., Nicholas, F. W., Collins, A. R., Zenger, K. R., Cavanagh, J. A., Barris, W., Schnabel, R. D., Taylor, J. F., and MacLeod, I. M., Hayes, B. J., and Goddard, M. E.: The effects of demography and long-term selection on the accuracy of genomic prediction with sequence data, Genetics, 198, 1671–1684, 2014.
MacLeod, I. M., Hayes, B. J., and Goddard, M. E.: The effects of demography and long-term selection on the accuracy of genomic prediction with sequence data, Genetics, 198, 1671–1684, 2014.
Matukumalli, L. K., Lawley, C. T., Schnabel, R. D., Taylor, J. F., Allan, M. F., Heaton, M. P., O'connell, J., Moore, S. S., Smith, T. P., and Sonstegard, T. S.: Development and characterization of a high density SNP genotyping assay for cattle, PloS One, 4, e5350, https://doi.org/10.1371/journal.pone.0005350, 2009.
Meuwissen, T. and Goddard, M.: Accurate prediction of genetic values for complex traits by whole-genome resequencing, Genetics, 185, 623–631, 2010.
Meuwissen, T., Hayes, B., and Goddard, M.: Prediction of total genetic value using genome-wide dense marker maps, Genetics, 157, 1819–1829, 2001.
Meuwissen, T., Luan, T., and Woolliams, J.: The unified approach to the use of genomic and pedigree information in genomic evaluations revisited, J. Anim. Breed. Genet., 128, 429–439, 2011.
Muir, W.: Comparison of genomic and traditional BLUP-estimated breeding value accuracy and selection response under alternative trait and genomic parameters, J. Anim. Breed. Genet., 124, 342–355, 2007.
Nejati-Javaremi, A., Smith, C., and Gibson, J.: Effect of total allelic relationship on accuracy of evaluation and response to selection, J. Anim. Sci., 75, 1738–1745, 1997.
R Core Team: R: a language and environment for statistical computing, R Foundation for Statistical Computing, Vienna, Austria, available at: http://cran.r-project.org, last access: 20 June 2016.
Solberg, T., Sonesson, A., Woolliams, J., and Meuwissen, T.: Genomic selection using different marker types and densities, J. Anim. Sci., 86, 2447–2454, 2008.
Speed, D., Hemani, G., Johnson, M. R., and Balding, D. J.: Improved heritability estimation from genome-wide SNPs, Am. J. Hum. Genet., 91, 1011–1021, 2012.
Sun, X., Fernando, R. L., Garrick, D. J., and Dekkers, J.: Improved accuracy of genomic prediction for traits with rare QTL by fitting haplotypes, Animal Industry Report, 661, 86–88, 2015.
Technow, F.: R Package hypred: Simulation of Genomic Data in Applied Genetics, University of Hohenheim, Institute of Plant Breeding, Seed Science and Population Genetics, Stuttgart, Germany, 2011.
Uemoto, Y., Sasaki, S., Kojima, T., Sugimoto, Y., and Watanabe, T.: Impact of QTL minor allele frequency on genomic evaluation using real genotype data and simulated phenotypes in Japanese Black cattle, BMC Genet., 16, 134–148, 2015.
VanRaden, P. M.: Efficient methods to compute genomic predictions, J. Dairy Sci., 91, 4414–4423, 2008.
VanRaden, P. M., Van Tassell, C., Wiggans, G., Sonstegard, T., Schnabel, R., Taylor, J., and Schenkel, F.: Invited review: Reliability of genomic predictions for North American Holstein bulls, J. Dairy Sci., 92, 16–24, 2009.
Wientjes, Y. C., Calus, M. P., Goddard, M. E., and Hayes, B. J.: Impact of QTL properties on the accuracy of multi-breed genomic prediction, Genet. Sel. Evol., 47, 42–58, 2015.
Wray, N. R.: Allele frequencies and the r2 measure of linkage disequilibrium: impact on design and interpretation of association studies, Twin Res. Hum. Genet., 8, 87–94, 2005.
Yan, J., Shah, T., Warburton, M. L., Buckler, E. S., McMullen, M. D., and Crouch, J.: Genetic characterization and linkage disequilibrium estimation of a global maize collection using SNP markers, PloS One, 4, e8451, https://doi.org/10.1371/journal.pone.0008451, 2009.